Update: This article was featured in the "Kotlin Weekly" newsletter issue #401 (Apr 7, 2024)! Huge thanks to the K.W. team for their support!
OpenTelemetry has a rather large "surface area," that is, quite a lot of concepts and components to understand just to achieve basic proficiency. Most of this article assumes the reader has experience building APIs with http4k but is just learning OpenTelemetry. Multiple external documentation sites are linked within the article, readers are highly encouraged to visit those sites for in-depth explanations.
Tracing, in short, provides the ability to observe the internal functioning and health of an application. Along with logs and metrics, traces help developers discover errors, bottlenecks, and other problematic conditions within their codebase. Unlike logs, traces contain structured data, in the form of attributes and events, and individual components of a trace, known as spans, can be arranged in hierarchal trees to help you understand which earlier component(s) spawned the current one. And unlike metrics, when an application slows down, your traces can report back the state of internal objects or the parameters sent to a particular function.
Simple metrics can tell you things like, the application slows down every day right around 9pm, or database queries sometimes time out when CPU load exceeds 80%. Telemetry, which reports on the internal execution path and the value of objects at each step, can help you find much more detailed, data-specific application issues, such as, this error only arises when a Gold-tier member tries to book an international flight reservation that starts and ends in different years, or a coupon code for one free appetizer works correctly if an order includes two distinct appetizers, but gives both for free when the order includes two of the same appetizer. Many of these types of issues are rare, only arise under specific conditions, and therefore, without telemetry, are very difficult to identify or to reproduce.
OpenTelemetry is an open-source, multi-language, vendor-agnostic framework for collecting instrumentation data, the aforementioned traces, metrics and logs. Multi-language is important, if parts of your application are written in something other than Kotlin. Vendor-agnostic is key because you aren’t locked into one specific observability vendor (think Datadog, New Relic, Grafana, etc) or self-hosted backend (Jaeger or Prometheus).
There are numerous introductions to OpenTelemetry that dive deep into its methodology and APIs, which I encourage you to read. After a few conceptual definitions, the rest of this article will discuss http4k’s OpenTelemetry extension, so getting a more complete picture will make the rest of the article easier to understand.
OpenTelemetry Introductory Articles
https://www.aspecto.io/blog/what-is-opentelemetry-the-infinitive-guide/
https://uptrace.dev/opentelemetry/architecture.html
https://logz.io/learn/opentelemetry-guide/
Defintions
Trace – A high-level unit of work, usually scoped to a single client request or a grouped series of requests (for example, a shopping cart checkout process).
Span – A small, single-scoped unit of work, such as a single function call or process. Traces are made up of multiple individual spans, and every span is a part of a trace. Further, spans can be organized hierarchically, i.e. parent/child relationships.
Distributed Trace – A trace that encompasses multiple systems or applications, for example, in a microservice architecture, the trace might include spans from the web server, application server, and numerous independent microservices
Trace Propagation – The messaging format used to share the current tracing metadata (the “context”) between all the systems and components of a distributed trace. A common, non-proprietary propagation spec ensures that, for example, a C# microservice running on Azure and a Kotlin microservice on AWS and a Rust microservice on GCP all share the same format and no translation or reformatting is necessary when passing trace data. It also ensures that all compatible observability vendors can collect, store and display your trace data, again, without any translation or reformatting.
Attributes – Key/Value data attached to spans. Typically, spans have resource attributes, which typically are fixed metadata attributes about the underlying application, such as its language, version, server name, etc. Span attributes are the application-specific values that you add to spans to record function parameters, object properties, client ids, etc.
Collector – A local application or service which receives all of the trace information that your application emits, and which is responsible for transmitting it to your observability vendor, or perhaps your own database, whatever. It is not absolutely necessary to use a collector, it’s possible to send every new data element directly to the vendor or database, but the collector significantly increases performance, like a message queue, because your application is only communicating with a local resource and the collector itself handles batching, network retries, encryption, etc. A highly-distributed application may have multiple collectors or a centralized one, similar to a load balancer or reverse proxy.
Setting up the Java SDK
https://opentelemetry.io/docs/languages/java/
Hopefully you have a pretty decent understanding of tracing at this point. Http4k’s OpenTelemetry (OTel) integration, as of this writing (March 2024), covers tracing and basic request metrics. Http4k also offers a separate Micrometer integration for metrics. As for logging, http4k is agnostic like many JVM projects, leaving it to underlying frameworks like SLF4J, log4j, or JUL, which can all be bridged to OTel.
Adding the http4k OTel library in your Gradle/Maven build provides access to a ServerFilter and a ClientFilter. It will also add the most common OTel libraries as dependencies, though you may find later you have additional libraries you’d like to add manually to incorporate more OTel features.
implementation("org.http4k:http4k-opentelemetry:5.14.1.0")
implementation("io.opentelemetry:opentelemetry-exporter-otlp:1.36.0") // not a dependency of above
The first step is to define an OpenTelemetrySdk singleton that defines the propagation spec and defines a TracerProvider (and, if desired, a MetricProvider and LoggingProvider, but those are out of scope of this article). You can define these in code, via SdkTracerProviderBuilder, and it’s also possible to define externally via environment variables, pulled in with AutoConfiguredOpenTelemetrySdk.initialize(). If you prefer environment variables, this documentation page defines each one along with a list of valid values.
object Telemetry {

    val otelSdk : OpenTelemetry
    init {
        otelSdk = buildOpenTelemetry()
    }

    private fun buildOpenTelemetry() : OpenTelemetry {

        // example resource data -- is added to every span, so be brief
        val resource: Resource = Resource.getDefault().toBuilder()
            .put(SERVICE_NAME, "my-app-name")
            .put(SERVICE_VERSION, "2.4")
            .put(DEPLOYMENT_ENVIRONMENT, "rhel-9-3")
            .put(HOST_ID, env.serverName) // for example, if you have multiple servers behind a load balancer
            .build()

        val sdk : OpenTelemetrySdk = OpenTelemetrySdk.builder()
            .setPropagators(ContextPropagators.create(W3CTraceContextPropagator.getInstance()))
            // most of this provider is simply using the defaults, and doesn't necessarily need to be defined explicitly
            // providers can also be defined via environment variables instead of code, if desired
            .setTracerProvider(
                SdkTracerProvider.builder()
                    .addSpanProcessor(
                        BatchSpanProcessor.builder(
                            OtlpGrpcSpanExporter.getDefault()
                        ).setExporterTimeout(4, TimeUnit.SECONDS)
                            .build()
                    ).setResource(resource)
                    .build()
            )
            // can also add a MetricProvider and/or LogProvider
            .buildAndRegisterGlobal()

        Runtime.getRuntime().addShutdownHook(Thread(sdk::close));

        return sdk
    }
}
Otel officially supports a number of existing propagator specs, including B3 (part of OpenZipkin) and Jaeger, but the default is W3C TraceContext. Others, like AWS X-Ray, are available from their vendors. If these projects are unfamiliar to you, don’t worry, they were all new to me as well. If starting a new project, sticking with the default W3C will probably be the best choice. One benefit of OTel is that going forward, vendors won't be defining custom protocols or APIs, freeing them up from enormous development work and saving you from application lock-in due to reliance on (or trapped by) a specific vendor implementation.
The TracerProvider is responsible for generating Tracers, which in turn create the spans which comprise traces. There should only be one TracerProvider, which is why an Sdk singleton is essential. It defines the span Resource Attributes and the SpanProcessor, which manages spans “under-the-hood,” such as defining how they will be exported from your application to the collector – batching vs individually, and the underlying protocol (gRPC vs http).
All of the TracerProvider’s work is wasted without a Collector ready to receive all the tracing output. Keep in mind the Collector is a separate program that must be managed and which utilizes memory, CPU and bandwidth on your system, so you are adding some operational complexity. To make things a bit more confusing, most releases of the official OTel collector contain a base version and a “contrib” version with more components, some in apha/beta stages, including those submitted by external vendors. There is a good chance that some of the functionality you eventually need is only available in the contrib version. Official releases for Linux, MacOS and Windows are available on Github, or you can pull from DockerHub and run as a container. Options for Kubernetes and HashiCorp Nomad are also available.
The Collector gets configured via a YAML file, such as the simple one below. Note that you identify a receiver and an exporter and group of services. Assuming you plan to run the executable directly, with the YAML file in the same directory, you can start it from a terminal: otelcol-contrib --config=file:opentelconfig.yaml
receivers:
  otlp: # the OTLP receiver the app is sending traces to
    protocols:
      grpc:
        endpoint: localhost:4317
      http:
        endpoint: localhost:4318

processors:
  batch:
    timeout: 5s

extensions:
  basicauth/otlp:
    client_auth:
      username: MY_USERNAME
      password: MY_PASSWORD

exporters:
  otlphttp:
    auth:
      authenticator: basicauth/otlp
    endpoint: https://backend-provider-ingest.com/otlp


service:
  extensions:
    - basicauth/otlp
  pipelines:
    traces:
      receivers: [otlp]
      processors: [batch]
      exporters: [otlphttp]
http4k integration
https://www.http4k.org/guide/reference/opentelemetry/
We’ve coded an Sdk and have an actively-running Collector – finally, now we can add tracing to our http4k API by using the provided ServerFilter. Simply adding the ServerFilter to your API’s routes declaration will automatically generate a single-span trace for every request received. Each span will be populated with attributes about the request, including http method, url, response size and status code. Each span also contains its start time and duration, so an immediate win is insight into the length of individual requests.
The ServerFilter accepts 5 parameters, giving you the opportunity to customize it, and to create different versions for different routes. The first 3 are basic, allowing you to choose a specific OpenTelemetrySdk (which is rarely necessary if you’ve built a global singleton), a naming pattern for spans (by default, the name is a string combining the http method and path), and a custom error message. The next two are more useful, the spanCreationMutator and spanCompletionMutator. As their names imply, these enable you to write custom functions than can access the full Request object (and Response, in the CompletionMutator) in order to add attributes or other data to your new span. For a route which is expecting a query parameter, or a certain header, or POST body, these values can immediately be transferred to the span.
    val myRoutes : RoutingHttpHandler = customOTelFilter.then( routes(
            // endpoints and more routes go here
            // item-id and user-token will be added to every span automatically on every call
        )
    )

    private val customOTelFilter : Filter = ServerFilters.OpenTelemetryTracing(
        spanCreationMutator = ::customMutator,
    )

    private fun customMutator(builder: SpanBuilder, req: Request) : SpanBuilder =
        builder.setAllAttributes(Attributes.of(
            AttributeKey.stringKey("item-id"), req.query("itemid") ?: "",
            AttributeKey.stringKey("user-token"), req.header("usertoken") ?: "",
        ))
Spans must be concretely end()’ed, they do not get garbage collected or automatically go out-of-scope (or if they do, they won’t be transmitted to the Collector). Fortunately, http4k’s ServerFilter will make sure end() gets called at the completion of the request.
So http4k’s filter makes it very easy to generate a span for every incoming request, to add data based on the request parameters and data, or that of the outgoing response, and to ensure the span’s end() method is properly called. It will also automatically set the span’s status to “error” if the request did not complete successfully.
But what about in between? What about capturing information about all of the internal functions that actually do the work of converting the incoming request data into a response? Yes, of course, we can capture that as well. This is not http4k-specific, but your span (technically, a Context) follows your application’s execution path until end() is called, which we know happens after the response is built. So when the route handler calls a processing function, which in turn executes a database query, after which, another function is called to process the results, which are sent to another function to insert the results into a template or package into a JSON object, wherever the execution path takes you, Span.current() is accessible and can accept new attributes, or, it can be referenced as the parent of a new span that you create. Building traces that encompass multiple spans, each covering one atomic function within your application, is the goal of tracing and helps you identify the state of parameters and internal objects that tend to cause problems within the application.
    val myRoutes : RoutingHttpHandler = customOTelFilter.then( routes(
            "/example" bind GET to { req : Request ->
                val item : Int = itemLens.extract(req)
                Response(Status.OK).body(doSomeComplexProcess(item))
            }
        )
    )

    // this is 90% pseudo-code, just to demonstrate various places to add data to Spans
    private fun doSomeComplexProcess(item : Int) : HtmlTemplate {
        // new Tracer (tracerProvider.get) can generate new Spans
        val childSpan : Span = openTelemetry.tracerProvider.get(Http4kOpenTelemetry.INSTRUMENTATION_NAME)
            .spanBuilder("child-span-name")
            .setParent(Context.current().with(Span.current())) // Span.current() is accessible to connect the spans
            .setAttribute("item-id", item.toLong()) // Ints not allowed, only Longs
            .startSpan()
        val sql: String = generateDBQueryString()
        val dbResult: String = doADatabaseLookup(sql).also {
            childSpan.addEvent("ran-query", Attributes.of(AttributeKey.stringKey("query-text"), sql))
        }
        childSpan.setAttribute("location", dbResult)
        return when {
            meetsSomeCondition -> {
                childSpan.setAttribute("another-attribute", "green")
                HtmlTemplate(item, dbResult, "a")
            }
            meetsADifferentCondition -> {
                childSpan.setAttribute("another-attribute", "yellow")
                HtmlTemplate(item, dbResult, "b")
            }
            else -> {
                childSpan.setAttribute("failed-to-match", true)
                HtmlTemplate(item, dbResult, "red")
            }
        }
    }
OK, so you’re creating all these traces and spans and populating them with attributes, the collector is running, so what is happening and where is everything going? The collector’s job is to complete the data pipeline, it receives the trace data emitted by your application and send it to some backend, or database. Let’s assume you use a hosted backend, such as Grafana or Honeycomb, you’ll be able to visualize your trace data on their site, something like:
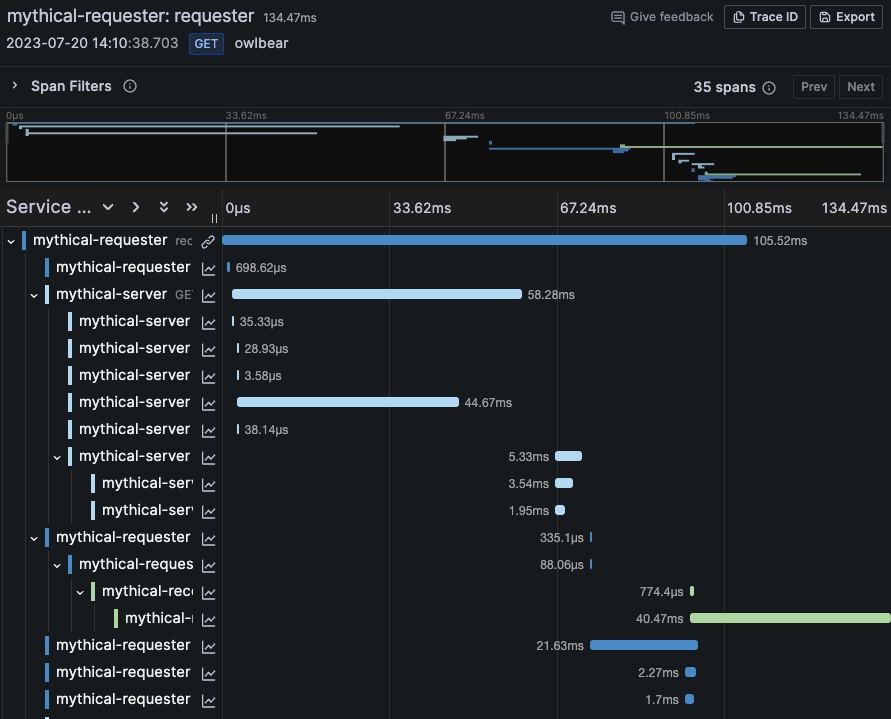
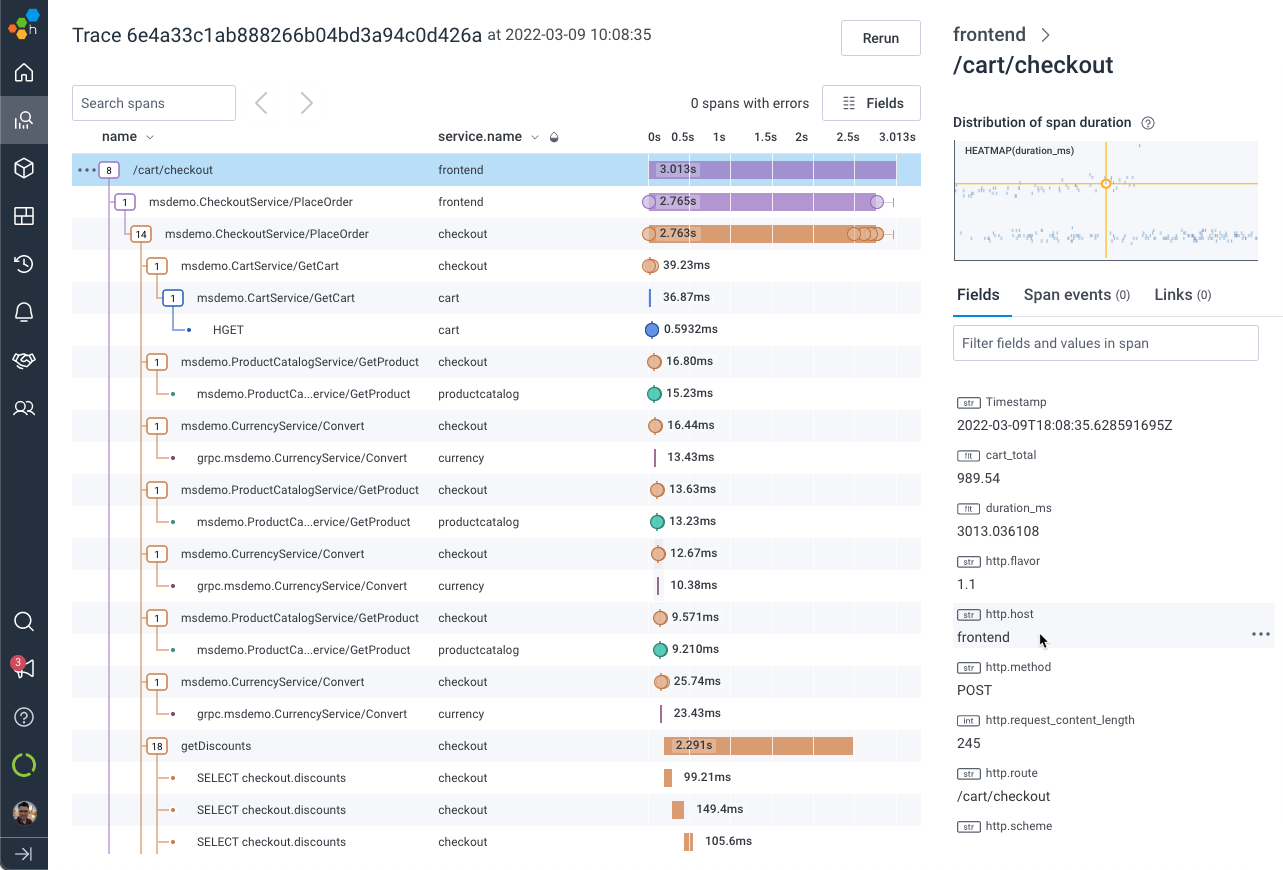
If these remind you of a browser DevTools Network tab, that’s not a surprise, as both use a waterfall visualization to display the timing and duration of each individual element of the overall request.
Distributed traces
Let’s go one step further. Up to this point, we’ve discussed an API whose internal implementation all runs within a single process on a single machine. But what about applications whose components aren’t all integrated together, which communicate via http calls, such as a microservice architecture? This is when understanding our Propagation spec is essential. Fortunately, http4k’s ServerFilter will automatically attach our span’s identifier to outgoing response headers. But picking that up in another process requires knowing where to look for it and how to parse it. The default W3C TraceContext format creates a single “traceparent” header with 4 hex components:
00-4bf92f3577b34da6a3ce929d0e0e4736-00f067aa0ba902b7-01
The 4 components represent the version, the trace id, the span id, and trace flags. Alternatively, the legacy B3 format uses 4 separate headers, all prefixed with x-b3-. A newer B3 spec uses a single, hyphenated header like the W3C format, but it includes a parent span id in lieu of versioning data, and encodes the components in a different order.
In any case, assuming you are building all your APIs with http4k, you can write a custom spanCreationMutator to connect distributed processes. Inside the mutator, you can read the proper header(s), create a Context from the propagated data, create a new Span from the new Context, then use the SpanBuilder.setParent() method to create a hierarchy between the calling process’s span and the new span generated by the API’s request. (Yes, confusing, but it does work).
    val myRoutes : RoutingHttpHandler = distributedOTelFilter.then( routes(
            // endpoints and more routes go here
            // spans generated within this set of routes will be children of the calling spans, from the `traceparent` header
        )
    )

    private val distributedOTelFilter : Filter = ServerFilters.OpenTelemetryTracing(
        spanCreationMutator = ::distributedSpanMutator,
    )

    private fun distributedSpanMutator(builder: SpanBuilder, req: Request) : SpanBuilder {
        val parentId : String = req.header("traceparent") ?: return builder
        val parentIdParts : List<String> = parentId.split("-")
        // must create a context from the individual header's parts, then re-create the parent span from that context
        val extractedContext : SpanContext = SpanContext.createFromRemoteParent(
            parentIdParts[1], parentIdParts[2], TraceFlags.fromHex(parentIdParts[3], 0),
            TraceState.getDefault()
        )
        val parentSpan : Span = Span.wrap(extractedContext)
        val parentContext : Context = Context.current().with(parentSpan)
        return builder.setParent(parentContext)
    }
You can also use a similar pattern to group together multiple distinct API requests from the same client. For example, a checkout process. The initial request is launched when the checkout button is clicked, followed by submitting a shipping address, choosing among possible shipping methods, submitting a payment method, a coupon code, upsell opportunities, etc. It makes sense to combine all of these individual API calls, coming from the same client, into a single trace. In order to accomplish this, you need to ensure the client includes the parent span's data with each subsequent request. Fortunately the traceparent header is automatically added to every response. But you could also add a different parent span to the response to organize the hierarchy differently. In any case, the only extra part is writing a simple JS/Swift/Kotlin method to read the previous response's header and ensure the intended value gets added to the subsequent call. This pattern essentially combines a full user session into a single trace, with every individual request and every atomic span all connected and available for review.